How to Create a Report for GA4 Events
You have a new option if you want to create a report for GA4 events. And that’s very good news, since the event-based data model in GA4 means that all important web interactions like clicks, downloads, form submissions, and purchases are tracked as events.
Here are the best options you have for creating a GA4 events report, starting with the simplest.
Modify an Existing Report to See GA4 Events
The simplest – and newest – option for creating a GA4 events report is to use a filter to modify an existing “standard” report.
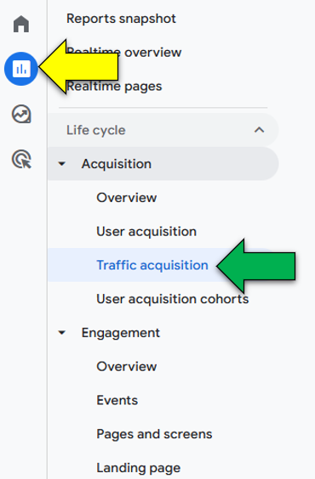
You can find standard reports at “Reports” in the GA4 left-hand navigation (yellow arrow below). Let’s choose the “Traffic acquisition” report (green arrow) which shows how visitors arrive on your website.
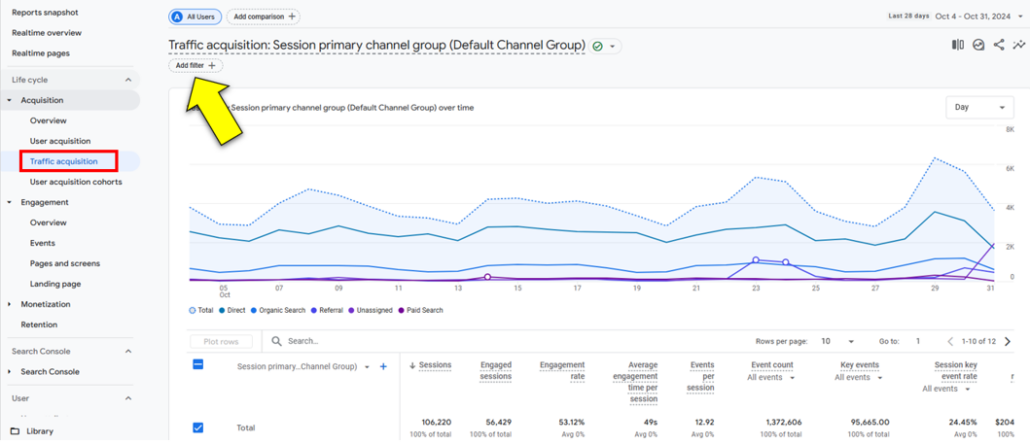
By default, this report will show all visits that came to your website. But now, as of November 2024, you can modify the report to only show visits that involved a specific event (or events) that you want to see.
Note: These screenshots are taken from the Google demo property, which has this new feature. If your GA4 property doesn’t yet have it, it will be added soon.
Click the “Add filter” button (yellow arrow) from within the Traffic acquisition report.
Now Build a Filter for a Specific Event
You can now set specific conditions to filter the data in the data in your chart and graph. Let’s apply filters so that we can create a report for one of our most important events.
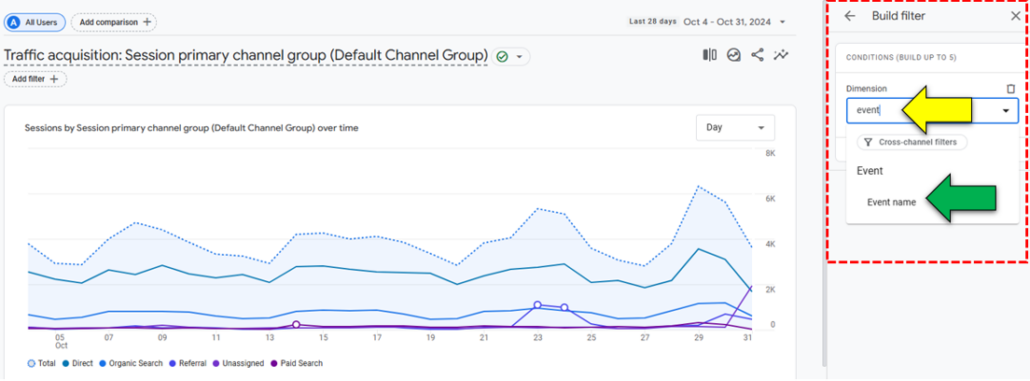
Begin typing “event name” (yellow arrow) in the Dimension field. And choose it (green arrow) once it’s visible in the drop-down.
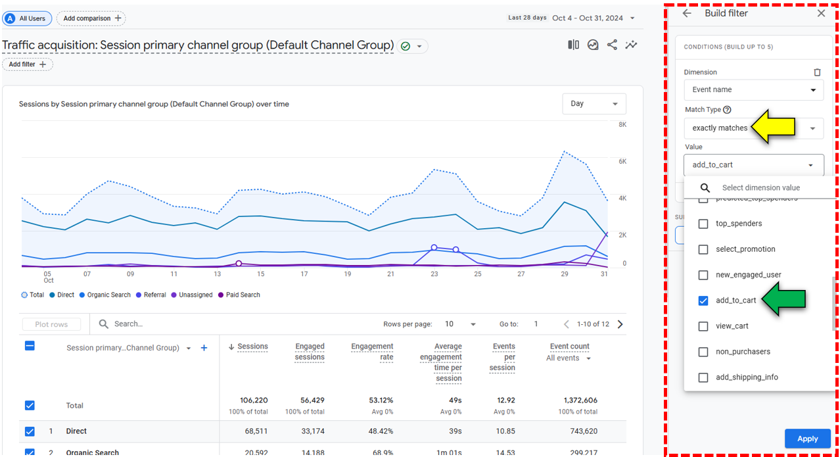
Now, fill out the other two conditions in your filter. Choose “exactly matches” for “Match Type” (yellow arrow) and then choose the specific event that you want to analyze in your event report. This specific website is an Ecommerce site and you can see that we picked the add_to_cart event (green arrow). This lets us analyze website visits that include this important event.
Click “Apply” once you’re done.
Your report rebuilds so that you’re only viewing those sessions that include the event you selected. The data table in the red box is limited to sessions with our add_to_cart event. You can see there are 5,473 sessions that hit the criteria, compared to 106,220 in the original report above.
At the yellow arrow, you can also see a reminder of what filter you have applied.
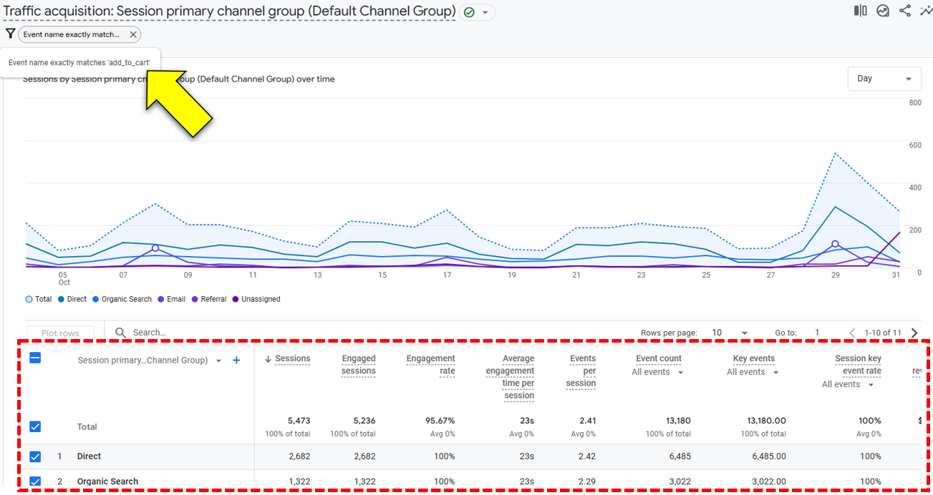
Note: You can choose multiple events when you create your filter. The filter will treat this as an OR condition.
How Can it Help?
This is a great report if you need granular information about a specific event. For example, you can analyze visitor behavior for your audience that takes a particular action (like adding an item to their shopping cart). And you can also see where those visitors come from.
You can see that at the traffic channel level, like Direct traffic vs. Organic Search vs. Paid Search vs. Organic Social and so on. To help you manage your traffic channels and prioritize time and budget accordingly.
And you can also analyze at the source / medium level. Like linkedin.com / referral vs. facebook.com / referral vs. pinterest.com / referral and so on. Which could help you find where you have opportunity for more exposure. If you are most interested in the traffic analysis portion of this event report, there may be an even simpler way.
Select a Specific Event in Your Traffic Acquisition Report
Parameters provide additional information about the ways users interact with your website. This is according to Google’s support article on the subject. They are one of the most critical parts of understanding GA4 events.
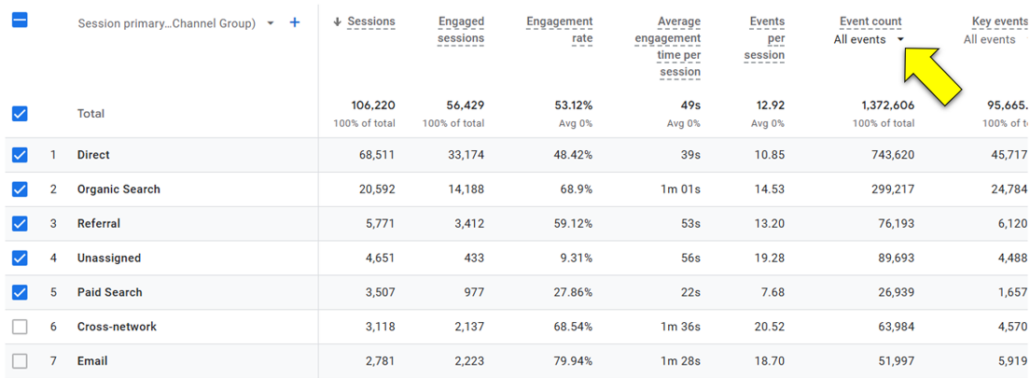
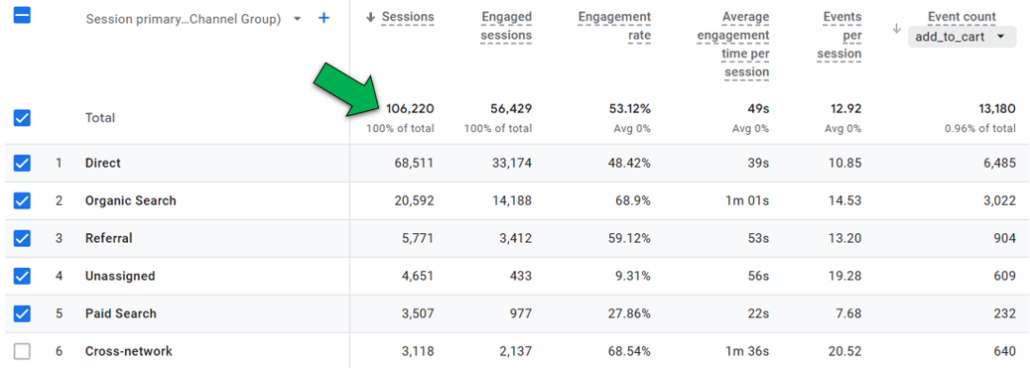
Remove any filters that are applied to your Traffic acquisition report. In your report table, look at the “Event count” metric. By default, this will show the total count of events that took place.
But if you click the small drop-down arrow (at yellow arrow) next to “All events” you can make your analysis more precise.
Clicking the drop-down reveals a list of all events that your GA4 property is recording. This includes things that GA4 will record by default like automatically collected events, as well as any custom events or recommended events that you’ve set up yourself.
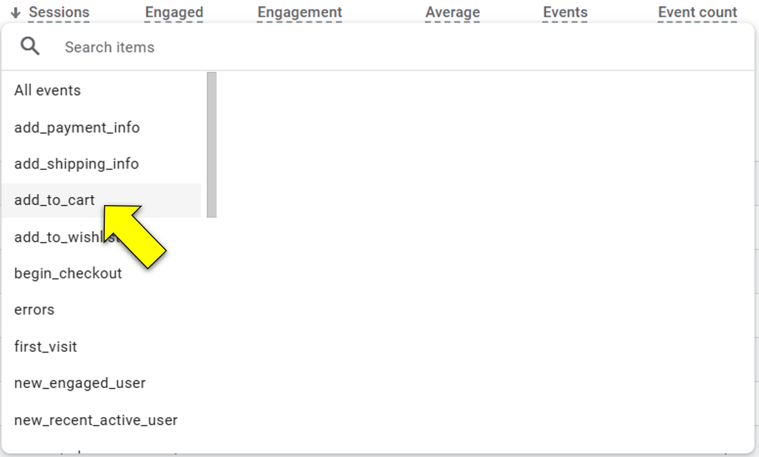
In this case, let’s choose the add_to_cart event which Google recommends that all ecommerce sites track. When it’s working properly, this event will fire whenever someone adds an item to their shopping cart.
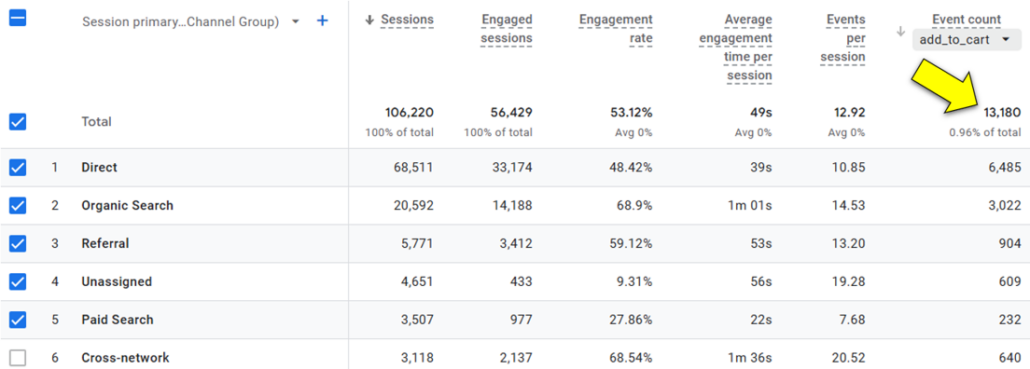
One downside to this approach relative to the first option we looked at is that the other metrics like engagement rate, average engagement time per session and events per session will not update. These metrics will still refer to your total traffic, not just the the traffic that is associated with the specific event you selected. You can see this clearly by taking a look at the green arrow, which shows the total number of sessions.
One other way to create a report for your GA4 events is to modify the standard GA events report. Let’s check it out.
The Built in GA4 Events Report
The “Events” report is a standard report. Find it at Reports → Life cycle → Engagement → Events. By default it will show the total number of events that took place for all events over a given period of time. And it will show events from all traffic sources.
But you can get more specific.
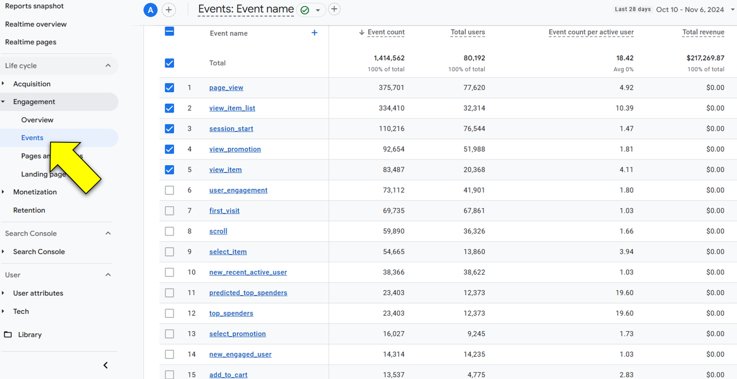
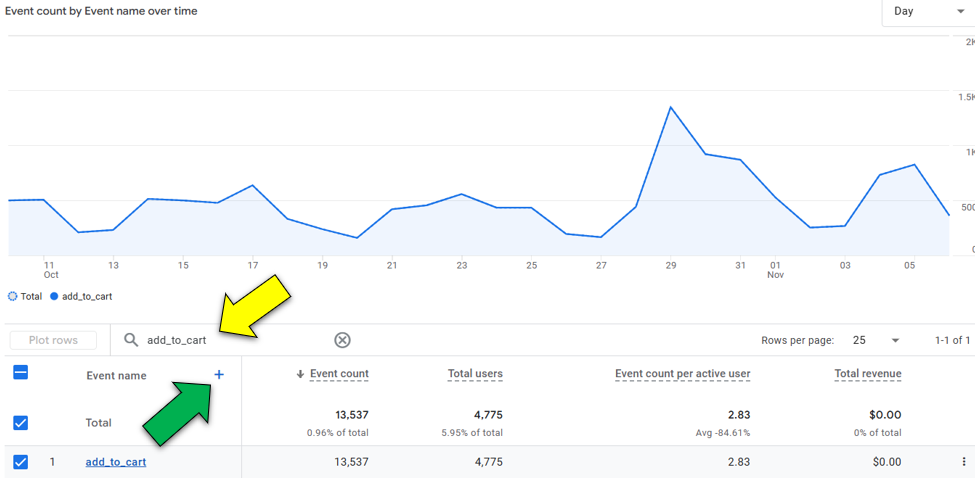
To do that, type the name of the event you want to analyze in the search field at the yellow arrow below. Hit “Enter” and the report will update to only show that event. The graphing feature is a nice addition so you can see what dates were most important for that event.
To add more granularity, hit the blue plus sign (green arrow) in order to add a secondary dimension.
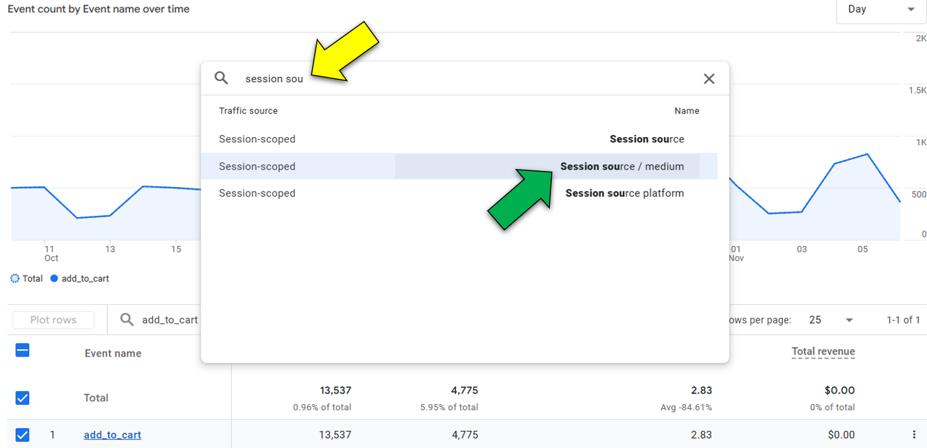
You’ll see a dialog box open. Begin typing “session source / medium” in the search box (yellow arrow). And select it once it’s visible on screen (green arrow).
The report will rebuild showing this new level of detail. If you’re more interested in a geographic analysis, you can add “Country” or “City” as your secondary dimension instead of Session source / medium. Or, you could do a device type analysis with the “Device category” dimension.
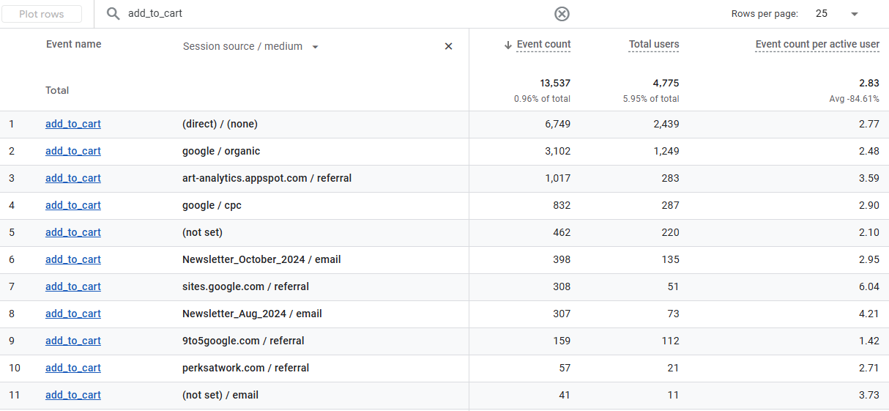
In our case, the Session source / medium dimension tells us some interesting things. We can see that nearly half of add_to_cart events come from direct traffic visits. These are mostly visits where the visitor directly typed our URL into the browser. But they can also represent visits where Google Analytics was confused and put the unknown traffic into direct. That means we may want to take a look at any UTM parameters we’re using to make sure Google can recognize them.
Wrapping Up
For even more detailed analysis, the best option is often to build a custom report using Explorations. That will allow you to select your own metrics and dimensions to make a report that looks exactly as you’d like it to look.
For example, you could build a file download report that shows not only traffic sources but also the file names of all files. Or, you could build a link clicks report that shows every link that was clicked. And which pages your visitors were on.
So if you’re not yet tracking your internal link clicks (and you want to), this video tutorial will help you set up your tracking and reporting.
About Root & Branch
Root and Branch focuses on SEO and analytics and uses tools like Google Analytics, Google Tag Manager, and Microsoft Clarity.
Read more here or click the button below to check out YouTube for more digital marketing tips and training resources.





Trackbacks & Pingbacks
[…] parameters will help you see your campaign tagged traffic. And this guide will show you to how to visualize your GA4 event […]
[…] GA4 event reporting […]
[…] There’s not a single place you can go in GA4 to see all your event parameters in a report. However, you can build your own reports that will give you the proper event parameter detail you need. Here’s how to create a GA4 events report. […]
[…] to want to view both your event data and relevant parameters. If you want three simple ways to create GA4 event reports, this article has you […]
Leave a Reply
Want to join the discussion?Feel free to contribute!