GA4 User Engagement: Understanding the User Engagement Metric
Updated: 1/27/25 The user engagement metric in GA4 is a standalone event and has direct implications for calculated metrics like engagement rate, bounce rate, and more.
In this guide you’ll learn about GA4 user engagement and how to better understand your GA4 reports.
What is GA4 User Engagement?
User engagement is an event-scoped metric that tells you how long your visitors are actively engaged with your site (or app).
As we will see, it has direct implications for engagement rate, bounce rate, average engagement time per session, and more.
Google has a simple definition for the user engagement metric in its support article:
User engagement is the amount of time someone spends with your web page in focus or app screen in the foreground, which allows you to measure when users actively use your site or app.
It all seems clear except for one possible confusing part. Let’s clarify.
What Does “In Focus” Mean Here?
If you’re anything like me, you often have multiple tabs open in your web browser. Some of them are web pages you plan to come back to in the future. Some are pages you’ll never come back to but you simply haven’t closed them yet. User engagement time will not count in those situations.
Instead, it will only count on the web page you are actively viewing on your screen.
With that basic foundation, let’s jump into the rest of this explainer.
How Does User Engagement Work?
Google Analytics uses an event parameter called “engagement_time_msec” to record user engagement time. The “msec” stands for milliseconds.
How does the timer work?
It starts at the time that a user begins a new session and GA4 begins to record the amount of time. The timer stops and the amount of time (in milliseconds) is sent to GA4 when one of the following happens:
- The user moves focus to another page in the browser. See above about what “in focus” means if you need a refresher.
- The user exits the web page or the web site crashes.
The engagement time is sent with the engagement_time_msec parameter. If a session is engaged, engagement time will periodically be sent to Google Analytics along with other events. This “periodically” part gets a little confusing and we’ll review it more.
What is an Engaged Session?
Google says that a session counts as engaged if any of the following is true:
- The session lasts longer than 10 seconds (although this can be customized)
- The session has 1 or more conversion
- The session has 2 more page views
According to this post from Analytics Mania, Google Analytics uses the “seg” parameter to indicate whether a session is counted as engaged or not. If the value is set to “0”, the session is not engaged. If the value is set to “1” the session is counted as engaged. This parameter changes according to the 3 conditions outlined above.
An event called user_engagement fires in GA4 when the session becomes engaged.
What is the GA4 user_engagement Event?
The user_engagement event will fire when a session becomes engaged (“seg” parameter moves from 0 to 1) and with some additional engagement events during those engaged session.
User engagement is confusing because it is both a record of time (sent as the engagement_time_msec parameter) and because it is an event that is logged in your GA4 event reporting. As you can see below in the screenshot from the Events reporting, there are 18,527 user_engagement events that fired and only 14,752 total users that were involved in those user_engagement events.
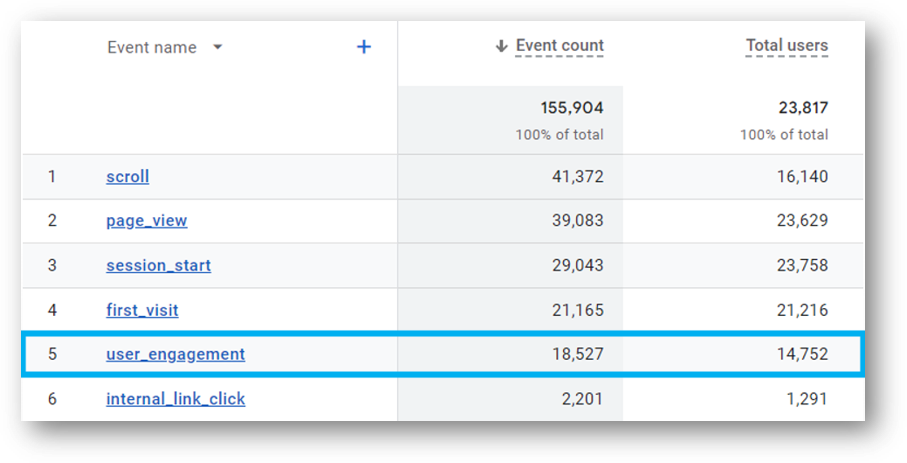
How is the event count 25.6% higher than the user count here? Check out 18,527 total events in the blue box relative to the 14,752 total users who were responsible for those user_engagement events. Clearly, there are other times that the user_engagement event is firing.
Let’s review.
When Does The User Engagement Event Fire?
The user_engagement event fires when a session becomes engaged. It also fires “periodically” in certain situation as users continue to engage with your website.
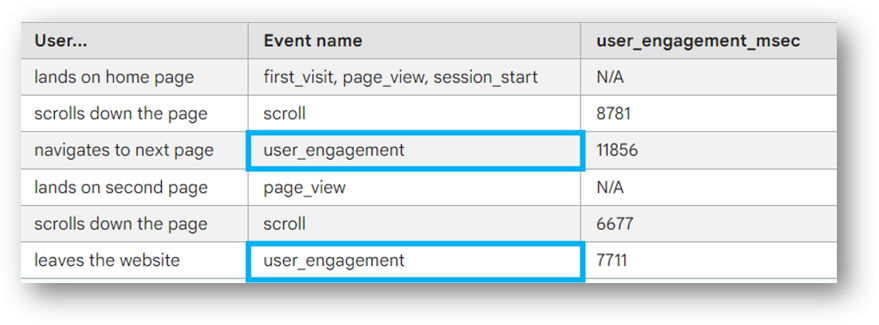
Here’s a sample scenario that Google shows us in their support article. Here’s what is happening:
- User lands on home page: first_visit, page_view, and session_start events all fire. No user_engagement_msec time is sent.
- User scrolls down the bottom of the page (the scroll enhanced measurement event fires at 90% scroll depth). The scroll event fires. Time is sent for the first time using user_engagement_msec along with the scroll event (8781 milliseconds).
- The user spends more time on the same page and clicks to navigate to a second page after (11856 milliseconds). These additional 11.8 seconds are sent using the user_engagement_msec event. We see in the first blue box that the user_engagement event fires here. It hits the conditions of an engaged session with 10 seconds on the page.
- When the user lands on the next page, a page_view event fires. No time is sent.
- The user scrolls all the way down (90%) the page and the scroll event fires once again. Time is sent along with that event using the user_engagement_msec parameter (6677 milliseconds).
- The user then leaves the site and the user_engagement event fires again as the user leaves the page. Why does it fire here? Google doesn’t tell us specifically. My hunch is that Google is signaling that a completed scroll is one of the events that will trigger a second user_engagement when the user exits the site.
Testing User Engagement With GA4 DebugView
You can use the GA4 DebugView to test when user_engagement event fires and when the engagement_time_msec event parameter gets passed.

What Happens With User Engagement When an Engaged Session Ends?
When I tested this, the user_engagement event is triggered when a session (that has already been classified as engaged) ends. If the session was not already an engaged session then user_engagement event will not fire when the user leaves.
Let’s see what happens when a user exits a session while testing with GA4 DebugView.
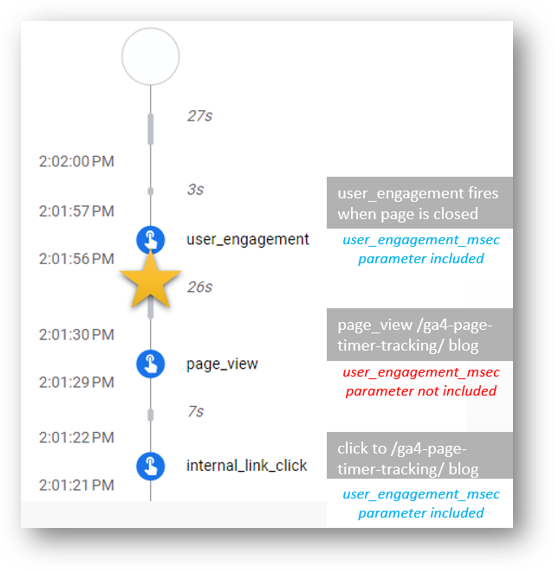
Note: There have been prior events not shown in the screenshot below, including an initial user_engagement event. This only shows the last three events that are logged. The most recent event is at the top of the event log.
- The third to last event is internal_link_click. The user (me!) was on this blog page and clicked over to this page timer tracking page. As you can see in the blue font, the engagement_time_msec parameter is passed along with the internal_link_click event.
- The second to last event is page_view. The user (still me) lands on the page timer tracking page. As you can see in the red font, the engagement_time_msec parameter is not passed along with the page_view event.
- See that yellow star? That is my own graphic that I added to show when I closed the page and ended the testing session. The page is no longer in view.
- The last event to fire is user_engagement. This event fires as the engaged session is ended. Note, I’m not certain as to all the critera that would be involved for user_engagement to fire a second time in an engaged session. As you can see in the blue font, the engagement_time_msec parameter is passed along with the internal_link_click event.
When is engagement_time_msec Parameter Passed?
In my testing, the engagement_time_msec parameter was passed with the scroll event, the internal link click custom event, the click event (external link click), and the user_engagement event.
As you can see, it did not pass with the page_view or session_start event.
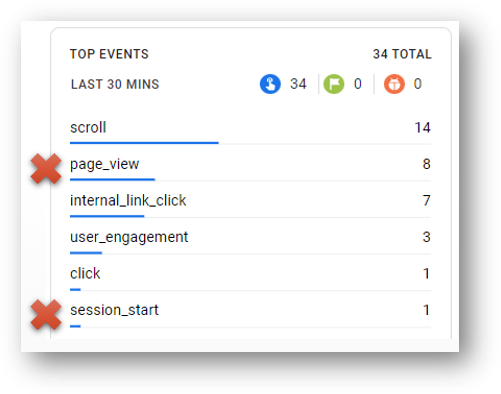
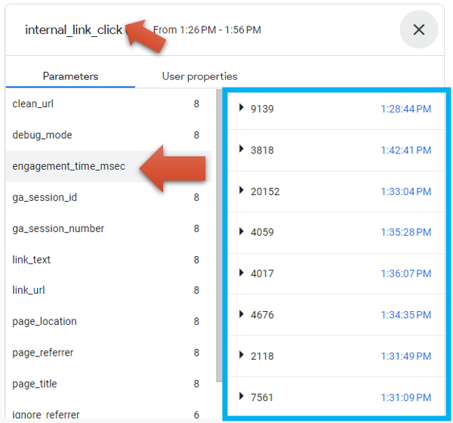
In the image below you can see the user engagement time that was passed along with the internal_link_click events. Check out the blue box to see the amount of time (in milliseconds). If you add all of that up, you’ll get 55,540 milliseconds, or just under 1 minute of engagement time sent with these events. Contrast that with the total length of the session, which is 30 minutes as you can see at the top of the image shown from 1:26 to 1:56.
It would appear that the engagement time is doing its job in trying to capture time when the user was actively engaged.
Other Notes About Engaged Sessions
According to the same previously linked Analytics Mania article, the engaged session calculation may be a bit different from what Google has explained. The distinction is that the 10 second criteria for an engaged session will only count if at least 10 seconds are on a single page. For example, if you stay on a page for 6 seconds, click to a second page, and then leave that second page after 6 more seconds then the user_engagement event will not fire. This is consistent with what I saw in my limited testing but different from Google’s documentation.
According to David Vallejo, the engagement_time_msec event paramter will pass not just on internal link clicks but also any other clicks to domains configured for cross domain tracking. This makes sense but is worth mentioning.
Engagement Metrics in GA4
User engagement and the engagement_time_msec parameter feature prominently into GA4 metrics related to time and engagement. Let’s look at some of the most important ones.
What is Average Session Duration in GA4?
Average session duration is a calculated, session-scoped metric in GA4 with a formatting type of TIME. The calculation is the total session duration in seconds divided by the total number of sessions.
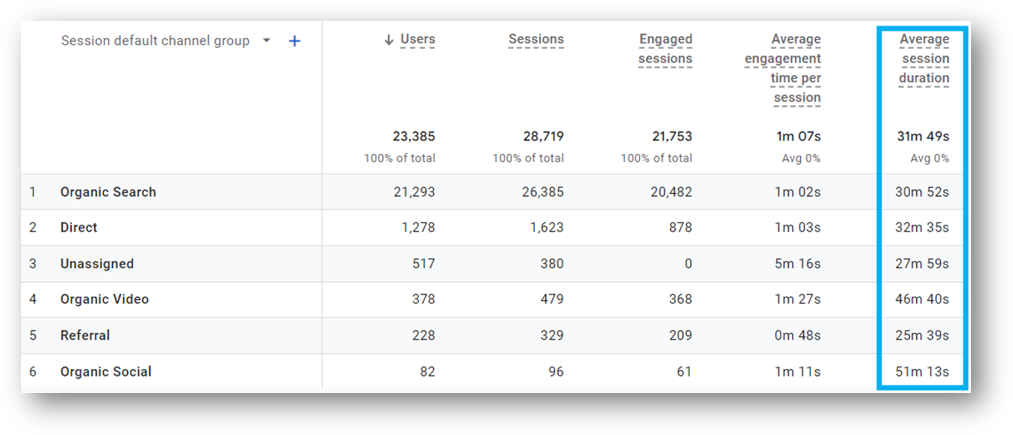
Unlike user engagement, session time will run until the session is ended or the session times out. There is no requirement for the page to be active and visible. The default session timeout is 30 minutes, but this can be changed when you configure your GA4 property. The table below shows a GA4 property where the session timeout had been increased from the default of 30 minutes. This helps explain the massive Average session duration. It’s worth noting that this average session duration is calculated differently in GA4 than in UA.
Average session duration is available in Looker Studio, Explorations, the API and for Customization. As you can see below, it is significantly higher than the Average engagement time per session.
Average Engagement Time Per Session
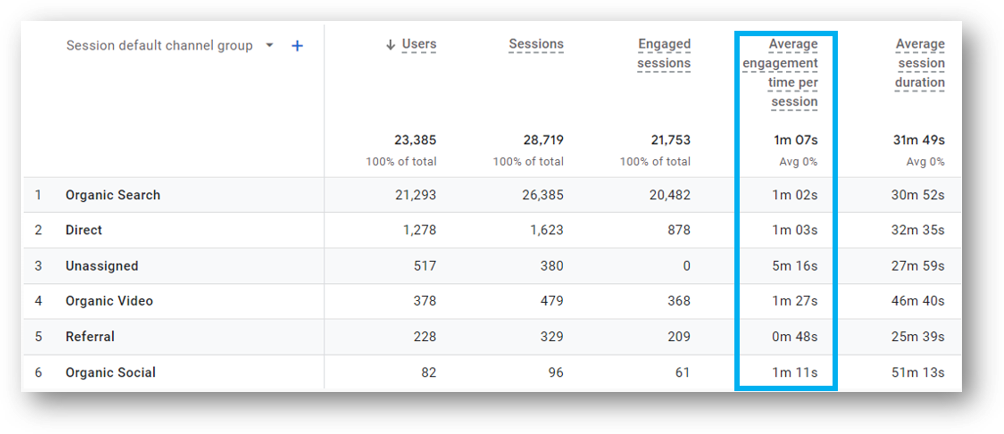
Average engagement time per session is a calculated metric in GA4 with a formatting type of TIME. The calculation is the total user engagement duration seconds divided by the total number of sessions.
Average engagement time is available in Explorations, Customization, and Custom Insight. As you can see below, it is significantly lower than the Average session duration and aims to show only the time that a user was actively engaged with your site (or app).
What is the Session Metric in GA4?
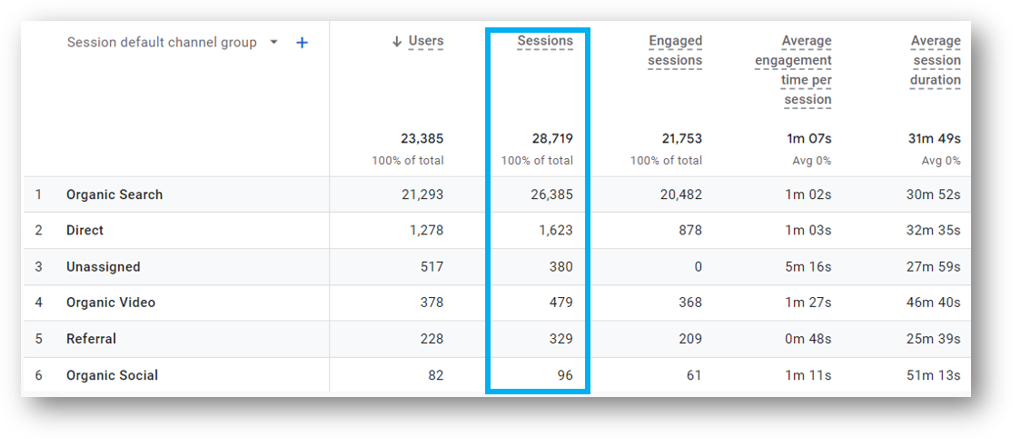
A session is a session-scoped metric in GA4 with a formatting type of INTEGER. It is not calculated. It counts the number of sessions on your website.
This count of sessions is used in calculated metrics like average session duration and average engagement time per session.
The session metric is available in Looker Studio, Explorations, the API and for Customization. As you can see below, it is significantly higher than the Average engagement time per session.
What is Engaged Sessions Per User in GA4?
Engaged sessions per user is a calculated, session-scoped metric in GA4 with a formatting type of FLOAT. The calculation is the total number of engaged sessions divided by the number of active users.
We’ve already reviewed the criteria for an engaged session (10 seconds or more of user engagement, or multiple pageviews, or has a conversion event). If you want to know more about the active users metric, check out this GA4 users guide.
Wrapping Up
Root & Branch believes good data can make life better. It’s not simply data collection, but thoughtful analysis that leads to better decision making.
Because deep thinking matters for important questions like whether sports betting is good for anyone other than the sports books. Or whether either right leaning or left leaning politics can really claim to be objectively better…and where the political “left” and “right” even came from.




Trackbacks & Pingbacks
[…] user_engagement event […]
[…] user_engagement event is one of the automatically collected events in GA4. This is the name of the event that fires when […]
[…] time component of the GA4 user engagement metric is the primary driver of the engagement rate discussions we’ve had here. If you were […]
[…] I’d recommend checking out this list of updated GA4 questions. This guide to the confusing user engagement metrics is also worth a […]
[…] now. Maybe you can go read about something more confusing in GA4 like event parameters or the user engagement event. But if you want to understand more about how to access your GA4 subdomain data, you can read […]
[…] to Google, the User engagement metric intends to show how long a user was actively engaged on your site or app. Engagement time is sent to Google Analytics along with the […]
Leave a Reply
Want to join the discussion?Feel free to contribute!